Product · Friction monitoring
Friction monitoring software for product teams
Automatically name UX friction points, prioritize drop-offs, and explain what blocks conversion before you drown in session replay.
9 min readUpdated May 18, 2026
Funnels show where. Friction monitoring shows why.
Named stalls on signup, checkout, and activation, ranked for the sprint you are in now.
Continuous · Prioritized · Plain language
Why friction monitoring matters
Most product teams discover drop-offs in a funnel report, then spend hours in session replay trying to name what went wrong. By the time someone agrees on a hypothesis, the sprint has moved on. Conversion rate is a lagging indicator—and aggregate charts rarely tell you whether the issue is copy, performance, a broken control, or confusion on a pricing step.
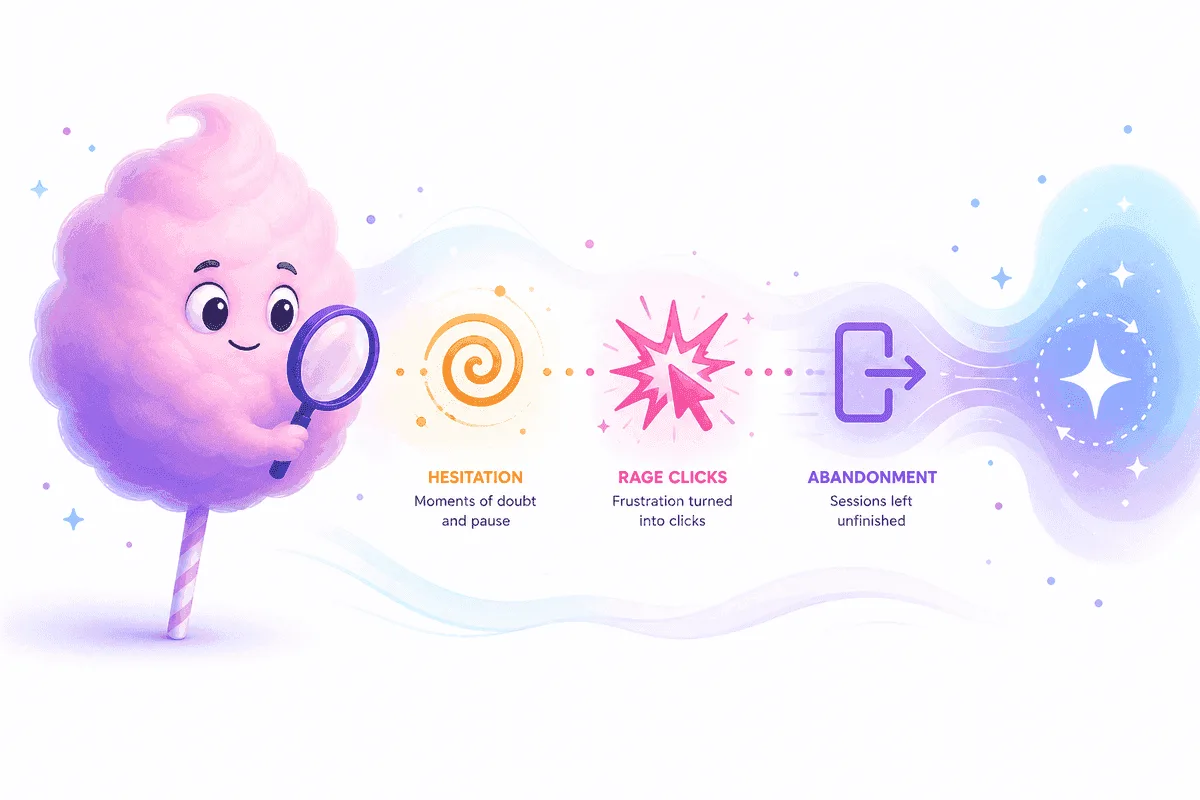
Friction monitoring closes that gap. Instead of sampling sessions at random, you get a continuous view of where users hesitate, rage-click, loop back, or abandon. Each pattern gets a name product can put on a backlog: checkout hesitation, plan comparison skip, form field rage—not anonymous red bars on a chart.
Funnels show the drop. Friction monitoring explains the stall—and ranks what to fix first.
That shift matters for founders shipping weekly and for PMs who already have Google Analytics or Mixpanel. Analytics tools excel at what happened. Tracuto sits on top as an intelligence layer that explains why, grounded in sessions, journeys, and events you already capture.

Patterns repeat across sessions—not one-off noise.
How friction monitoring works in Tracuto
You add one async loader snippet, verify tracking on your domain, and let sessions accumulate. Tracuto watches key flows—signup, onboarding, activation, checkout—and clusters behavioral signals into friction points. Each point includes a short explanation, impact context, and links to representative sessions when you need proof.
- 1
Install & verify
Paste the loader, allowlist domains, and confirm events in production. The integration guide covers masking, consent, and checklist items before you trust insights in standup.
- 2
Define key flows
Map the steps that matter for revenue: signup, onboarding, activation, checkout. Funnels and journeys give structure; friction attaches to each step.
- 3
Surface named friction
AI-assisted analysis names patterns—hesitation, rage clicks, failed actions—and ranks them so you fix high-impact issues before low-traffic edge cases.
- 4
Verify with replay
Open session replay when you need to confirm UI state, share a clip with design, or validate a fix shipped correctly. Discovery is automated; proof stays one click away.
Friction monitoring vs. funnels vs. session replay
Teams often stack all three tools without a clear division of labor. Here is how each layer fits—and where friction monitoring sits in the stack.
| Capability | Funnels / GA | Friction monitoring (Tracuto) |
|---|---|---|
| Primary question | Where did users drop? | Why did they stall before exit? |
| Output | Step conversion %, cohort trends | Named friction + prioritized queue |
| Triage model | Manual drill-down per step | Automated first pass, replay for proof |
| Best for | Reporting, acquisition, top-line KPIs | Product backlog, UX fixes, weekly shipping |
| Session replay alone | Proof when you know which session | Proof after intelligence picks the session |
Who friction monitoring is for
Founders & product owners
You ship weekly and need a second pair of eyes on UX—not another dashboard to babysit. Friction monitoring turns behavior into a short list of fixes with language you can use in standup.
Product managers
You own activation and checkout. Named friction gives you backlog items with evidence links instead of debates driven by whoever watched the most replays last week.
Growth & marketing
When conversion drops, you need mechanism—not only magnitude. Tie campaign or pricing changes to session-level stalls before you rerun ads or rewrite landing copy.
UX & research
Use prioritized friction to decide which flows to study deeply. Replay remains your verification tool; intelligence reduces random sampling.
Use cases: signup, onboarding, checkout
Signup and account creation
Watch for repeated submits on the same field, long dwell without progress, and exits right after social login errors. Friction labels like "email verification loop" or "password rules confusion" beat a flat signup conversion percentage when you are prioritizing the next sprint.
Onboarding and activation
Activation is where many SaaS products leak. Monitor steps where users skip optional setup, abandon empty states, or bounce between help docs and the product. Week-over-week friction trends show whether a release helped or introduced a new stall.
Checkout and pricing
Pricing tables, plan comparison, and payment fields generate subtle friction—hover without click, back navigation from checkout, abandonment after tax or shipping surprises. Session-level context explains whether the fix is copy, layout, performance, or trust—not only that checkout conversion fell.
Read more in our guide on why users don't convert and our session analytics overview.
Install, consent, and privacy
Tracuto does not turn itself on—you add the loader when you are ready and keep your consent banner in control. The integration guide covers domain allowlists, event verification, field masking, and production checklist steps. Review our Privacy Policy for how data is processed.
Starter includes a 14-day trial with no credit card required. See pricing for event, recording, and AI analyze quotas per plan.
Frequently asked questions
- What is friction monitoring?
- Friction monitoring continuously watches real user sessions, clusters behavioral patterns (hesitation, rage clicks, back-navigation, abandonment), and returns named friction points with plain-language explanations so product teams know what to fix first.
- How is friction monitoring different from funnel analytics?
- Funnels show where users drop. Friction monitoring explains why they stall at each step, linking aggregate drop-offs to repeatable session-level behaviors you can prioritize and assign to a backlog.
- Do I still need session replay if I use friction monitoring?
- Yes, when you need proof. Tracuto surfaces prioritized friction first; open replays to verify UI state, share clips with design, or confirm a fix shipped correctly.
- Which flows should I monitor first?
- Start with signup, onboarding, activation, and checkout: the steps where a small UX issue has outsized revenue impact. Add pricing and plan comparison once core conversion paths are stable.
- How long until I see named friction?
- Most teams add the loader, verify events, and see first signals within a short session. Deeper patterns strengthen as more sessions are analyzed. See the integration guide for production checklist steps.
- Does friction monitoring work with Google Analytics?
- Yes. Analytics tools excel at what happened; Tracuto adds an intelligence layer on top of sessions and journeys that explains why users drop off, grounded in real behavior.
- Is there a free trial?
- Starter includes a 14-day trial with no credit card required. Paid plans scale event, recording, and analyze quotas; see pricing for limits.
Related reading
Product · Session analytics
Session analytics and drop-off analysis
Connect events, journeys, and session context into explanations you can act on: friction labels, drop-off drivers, and repeating patterns.
8 min read
Article · Conversion
Why users don't convert (and how to find out)
Conversion rate is a lagging indicator. Learn to find stalls, name friction, and automate the first pass before manual replay review.
7 min read
Article · Session replay
Beyond session replay: product intelligence
Replays are proof, not a scalable triage system. Product intelligence adds discovery before you open the player.
7 min read